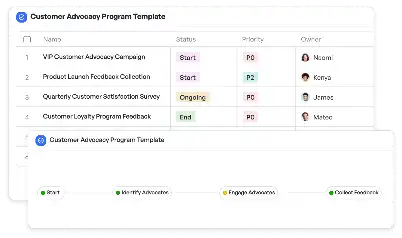
Real-Time JVM Metrics Analysis
Achieve project success with the Real-Time JVM Metrics Analysis today!

What is Real-Time JVM Metrics Analysis?
Real-Time JVM Metrics Analysis refers to the continuous monitoring and evaluation of Java Virtual Machine (JVM) performance metrics in real-time. This process is crucial for developers and system administrators to ensure optimal application performance, identify bottlenecks, and prevent potential system failures. JVM, being the runtime environment for Java applications, handles critical tasks such as memory management, thread execution, and garbage collection. Real-time analysis of these metrics allows teams to detect anomalies, optimize resource allocation, and maintain system stability. For instance, monitoring heap memory usage can help prevent out-of-memory errors, while tracking garbage collection times can improve application responsiveness. In industries like finance, where milliseconds matter, real-time JVM metrics analysis is indispensable for maintaining high-performance systems.
Try this template now
Who is this Real-Time JVM Metrics Analysis Template for?
This Real-Time JVM Metrics Analysis template is designed for software developers, DevOps engineers, and system administrators who manage Java-based applications. It is particularly beneficial for teams working in high-stakes industries such as finance, e-commerce, and telecommunications, where application performance directly impacts user experience and revenue. Typical roles include backend developers monitoring application health, DevOps teams ensuring system reliability, and IT managers overseeing infrastructure performance. For example, an e-commerce platform experiencing high traffic during a sale can use this template to monitor JVM metrics and ensure seamless user transactions.

Try this template now
Why use this Real-Time JVM Metrics Analysis?
The Real-Time JVM Metrics Analysis template addresses specific challenges faced in JVM-based application environments. One common pain point is the difficulty in identifying memory leaks, which can lead to application crashes. This template provides tools to monitor heap memory usage and detect anomalies early. Another issue is inefficient garbage collection, which can cause application latency. By analyzing garbage collection metrics in real-time, teams can optimize configurations to reduce delays. Additionally, thread pool mismanagement often results in performance bottlenecks. This template helps track thread utilization, enabling better resource allocation. By focusing on these JVM-specific challenges, the template ensures robust application performance and reliability.

Try this template now
Get Started with the Real-Time JVM Metrics Analysis
Follow these simple steps to get started with Meegle templates:
1. Click 'Get this Free Template Now' to sign up for Meegle.
2. After signing up, you will be redirected to the Real-Time JVM Metrics Analysis. Click 'Use this Template' to create a version of this template in your workspace.
3. Customize the workflow and fields of the template to suit your specific needs.
4. Start using the template and experience the full potential of Meegle!
Try this template now
Free forever for teams up to 20!
The world’s #1 visualized project management tool
Powered by the next gen visual workflow engine


