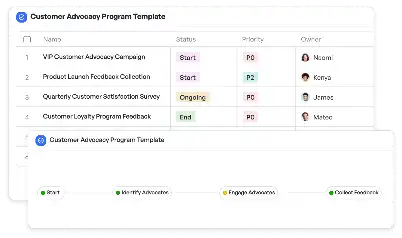
Auto-Scaling Health Metrics Dashboard
Achieve project success with the Auto-Scaling Health Metrics Dashboard today!

What is Auto-Scaling Health Metrics Dashboard?
The Auto-Scaling Health Metrics Dashboard is a specialized tool designed to monitor and manage the health of systems that utilize auto-scaling capabilities. Auto-scaling is a critical feature in cloud computing environments, allowing systems to dynamically adjust resources based on demand. This dashboard provides real-time insights into key metrics such as CPU usage, memory consumption, and network traffic, ensuring that scaling decisions are data-driven and effective. By visualizing these metrics, teams can identify bottlenecks, predict potential failures, and optimize resource allocation. For instance, in a high-traffic e-commerce platform, the dashboard can help ensure that servers scale up during peak shopping hours and scale down during off-peak times, reducing costs while maintaining performance.
Try this template now
Who is this Auto-Scaling Health Metrics Dashboard Template for?
This template is ideal for IT administrators, DevOps engineers, and cloud architects who manage dynamic and scalable systems. It is particularly useful for organizations that rely on cloud-based infrastructure, such as SaaS providers, e-commerce platforms, and streaming services. Typical roles that benefit from this dashboard include system administrators who need to ensure uptime, DevOps teams responsible for implementing auto-scaling policies, and business analysts who require insights into system performance trends. For example, a DevOps engineer at a video streaming company can use the dashboard to monitor server health during a live event, ensuring uninterrupted service for millions of viewers.

Try this template now
Why use this Auto-Scaling Health Metrics Dashboard?
Managing auto-scaling systems comes with unique challenges, such as identifying the right scaling thresholds, avoiding over-provisioning, and ensuring system stability during scaling events. The Auto-Scaling Health Metrics Dashboard addresses these pain points by providing a centralized view of all relevant metrics. It helps teams set precise scaling policies by analyzing historical data and real-time trends. Additionally, the dashboard reduces the risk of downtime by alerting teams to anomalies before they escalate into critical issues. For example, if a sudden spike in traffic is detected, the dashboard can trigger an alert, allowing the team to preemptively scale resources. This proactive approach not only enhances system reliability but also optimizes operational costs.

Try this template now
Get Started with the Auto-Scaling Health Metrics Dashboard
Follow these simple steps to get started with Meegle templates:
1. Click 'Get this Free Template Now' to sign up for Meegle.
2. After signing up, you will be redirected to the Auto-Scaling Health Metrics Dashboard. Click 'Use this Template' to create a version of this template in your workspace.
3. Customize the workflow and fields of the template to suit your specific needs.
4. Start using the template and experience the full potential of Meegle!
Try this template now
Free forever for teams up to 20!
The world’s #1 visualized project management tool
Powered by the next gen visual workflow engine


