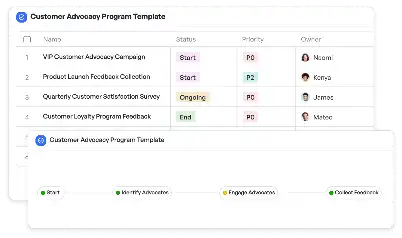
Technical Quality Metrics Dashboard
Achieve project success with the Technical Quality Metrics Dashboard today!

What is Technical Quality Metrics Dashboard?
A Technical Quality Metrics Dashboard is a centralized platform designed to monitor, analyze, and visualize key performance indicators (KPIs) related to the technical quality of systems, applications, or processes. This dashboard is essential for teams aiming to maintain high standards in software development, IT operations, and system reliability. By consolidating metrics such as error rates, response times, and system uptime, the dashboard provides actionable insights that help teams identify bottlenecks, predict potential failures, and ensure optimal performance. For instance, in a software development environment, the dashboard can track code quality metrics like cyclomatic complexity or defect density, enabling teams to address issues proactively. The importance of such a tool lies in its ability to provide real-time data, ensuring that technical teams can make informed decisions quickly and effectively.
Try this template now
Who is this Technical Quality Metrics Dashboard Template for?
The Technical Quality Metrics Dashboard template is tailored for professionals and teams who are deeply involved in maintaining and improving the technical quality of their systems. This includes software developers, IT operations managers, quality assurance engineers, and DevOps teams. For example, a DevOps team can use the dashboard to monitor CI/CD pipeline performance, ensuring that deployments are smooth and error-free. Similarly, IT operations managers can leverage the dashboard to track server health and network performance, ensuring minimal downtime. Quality assurance engineers can use it to analyze test coverage and defect trends, ensuring that the product meets the desired quality standards. Essentially, this template is for anyone who needs a comprehensive view of technical metrics to make data-driven decisions.

Try this template now
Why use this Technical Quality Metrics Dashboard?
The Technical Quality Metrics Dashboard addresses several pain points that technical teams often face. For instance, without a centralized dashboard, teams may struggle with fragmented data sources, making it difficult to get a holistic view of system performance. This template solves that by aggregating data from multiple sources into a single, easy-to-navigate interface. Another common issue is the lack of real-time insights, which can delay critical decision-making. The dashboard provides real-time updates, ensuring that teams can act swiftly to address issues. Additionally, the dashboard is customizable, allowing teams to focus on the metrics that matter most to their specific use case. For example, a team working on a high-traffic e-commerce platform can prioritize metrics like page load time and transaction success rate, while a team managing a cloud infrastructure can focus on server uptime and resource utilization. By using this dashboard, teams can not only identify and resolve issues faster but also continuously improve their processes and systems.

Try this template now
Get Started with the Technical Quality Metrics Dashboard
Follow these simple steps to get started with Meegle templates:
1. Click 'Get this Free Template Now' to sign up for Meegle.
2. After signing up, you will be redirected to the Technical Quality Metrics Dashboard. Click 'Use this Template' to create a version of this template in your workspace.
3. Customize the workflow and fields of the template to suit your specific needs.
4. Start using the template and experience the full potential of Meegle!
Try this template now
Free forever for teams up to 20!
The world’s #1 visualized project management tool
Powered by the next gen visual workflow engine


