Project Management KPIs in 2025 [+ How to Track Them]

You’ve got the project plan, the tools, and the team in place. But to truly understand whether your project is on track, you need more than just good intentions and a checklist. You need clear, measurable indicators of progress—ones that show if your timelines are realistic, your resources are optimized, and potential risks are under control.
So how do you do all this? The answer is project management KPIs.
In this blog, we’ll explore the most relevant KPIs for 2025—what they are, why they matter, and how to track them effectively. Whether you're managing a complex cross-functional initiative or refining internal workflows, these KPIs will help you drive smarter decisions, improve performance, and deliver consistent results.
What are project management KPIs?
Project management key performance indicators (KPIs) are quantifiable metrics that assess a project’s progress, performance, and overall effectiveness. They track timeline adherence, budget accuracy, risk management, and team productivity, offering data-driven insights to refine project planning and improve outcomes.
KPI priorities shift as projects advance. During initiation, focus on scope clarity and resource allocation; in execution, track project timelines, risks, and collaboration; and near closure, prioritize delivery quality and stakeholder satisfaction. This progression ensures KPIs stay aligned with the project lifecycle and strategic goals.
Which industry-specific KPIs to track?
While all project teams track core KPIs—like timelines, budgets, and stakeholder engagement, the priority**** KPIs can vary significantly by industry. That’s because each industry defines “success” differently: some prioritize customer retention, others speed to market, and others focus on operational efficiency or compliance.
SaaS companies typically prioritize metrics like sprint velocity, feature delivery rate, bug resolution time, user adoption, and release cycle frequency because these KPIs directly impact service quality, user satisfaction, and competitive edge. They enable rapid iteration, clear performance visibility, and timely responsiveness to customer feedback, all of which are critical for business success.
Suggested read: 11 Product Management KPIs in 2025 [+ How to Track Them]
Why track project management metrics?
Tracking project management metrics provides actionable insights that help teams stay aligned, validate progress, make informed decisions, and improve project delivery. Benefits include:
 Source: Freepik
- Monitor KPIs like schedule variance and task completion rates to identify early signs of delay or misalignment. A missed milestone, for instance, could point to unclear scope or resource gaps.
- Improve team morale with clear metrics that show how individual contributions support broader project goals, encouraging accountability and motivation.
- Adapt strategies in real time using metrics like cycle time and resource utilization to stay on track and meet evolving priorities.
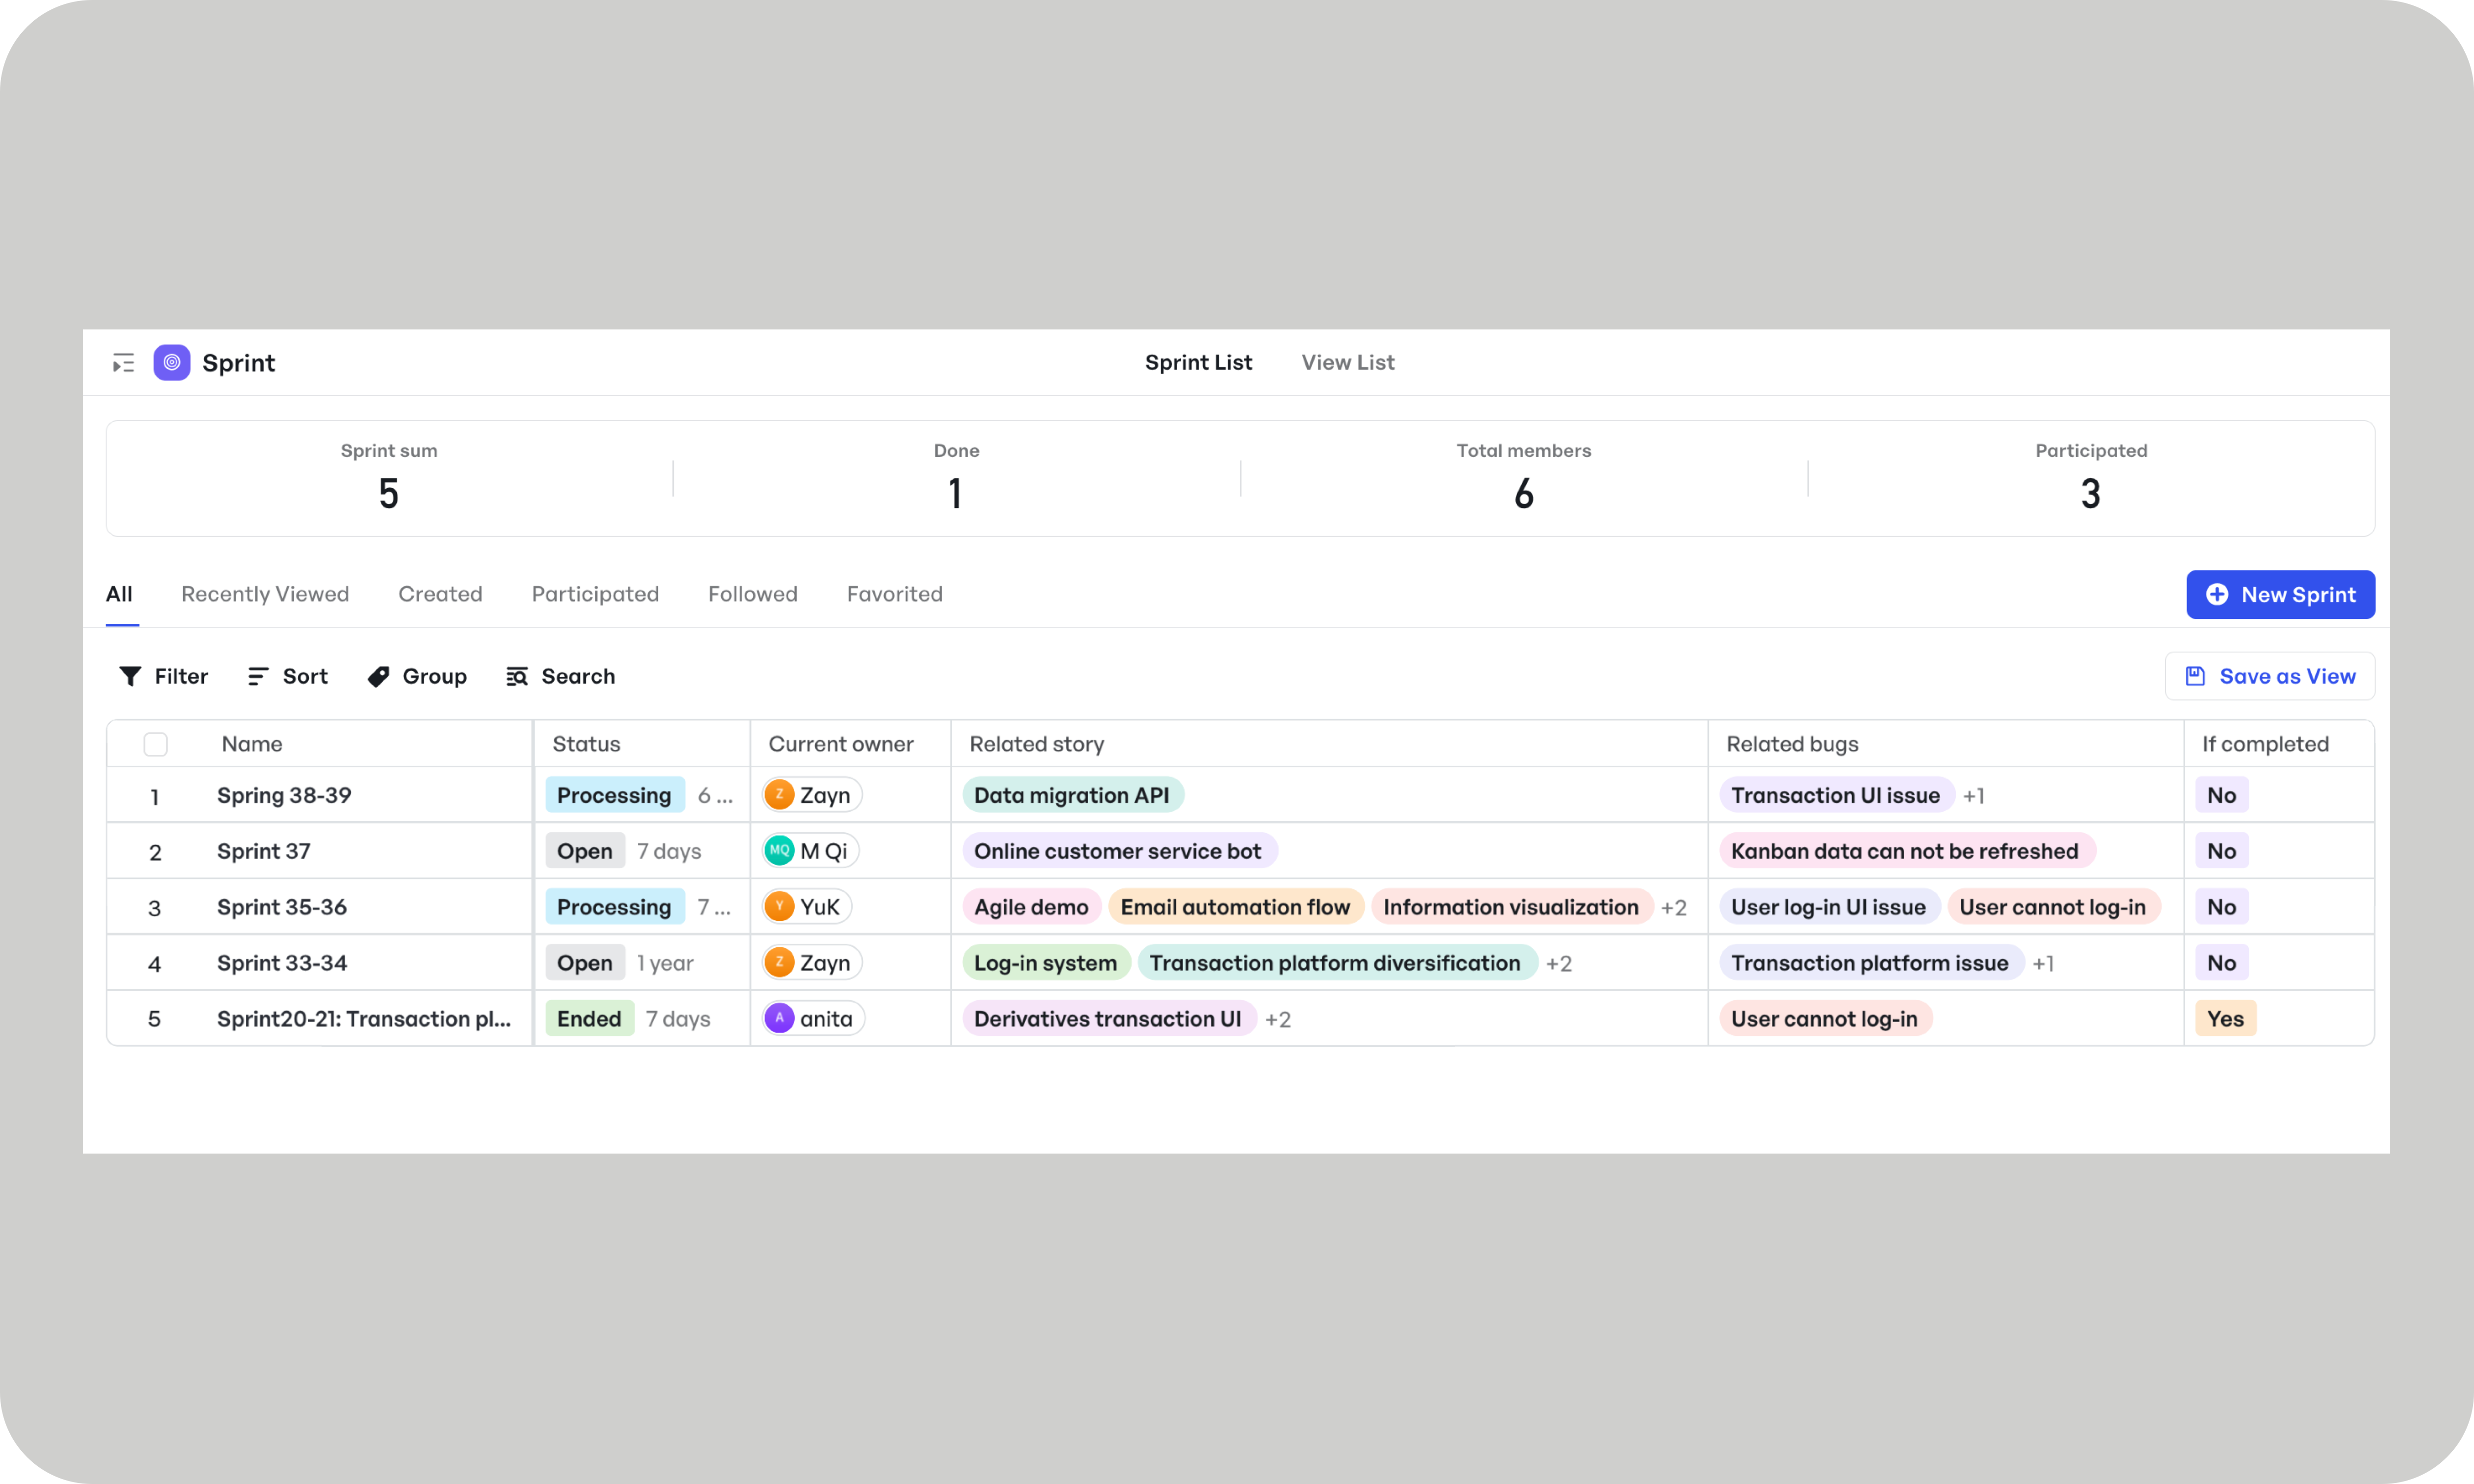 Planning sprints in Meegle's Agile Development Template
- Optimize workflows by analyzing metrics like sprint velocity and defect rates, which highlight inefficiencies and areas for improvement.
- Spot trends in project performance, such as repeated delays or budget variances, to adjust plans early and ensure long-term success.
Related Read:
Strategic vs. tactical project development KPIs
Strategic and tactical project management KPIs serve different purposes. Below is a tabular comparison of their key aspects:
| KPI Type | Focus | Purpose | Measurement | Examples |
|---|---|---|---|---|
| Strategic KPIs | Long-term goals, project impact, stakeholder value | Evaluate whether the project aligns with business objectives and delivers lasting value | Tracked over longer periods to assess value realization, customer impact, and organizational alignment | Return on Investment (ROI), Benefit Realization Rate, Customer Satisfaction Score (CSAT), Net Promoter Score (NPS) |
| Tactical KPIs | Short-term execution, operational efficiency | Monitor daily/weekly performance, identify bottlenecks, and ensure timely, quality delivery | Monitored frequently during project lifecycle to guide course corrections and maintain delivery momentum | Schedule Variance, Development Velocity, Time-to-Market (TTM), Cost Performance Index (CPI), Defect Rate |
Essential project management KPIs to track
Understanding the different factors driving your project's success is important, because what gets measured, gets improved.
Monitoring the right KPIs gives you a 360-degree view of project performance, covering everything from stakeholder satisfaction and team productivity to delivery timelines and budget health. Review these metrics continuously to ensure consistent delivery, stronger outcomes, and long-term project value.
Operational efficiency metrics
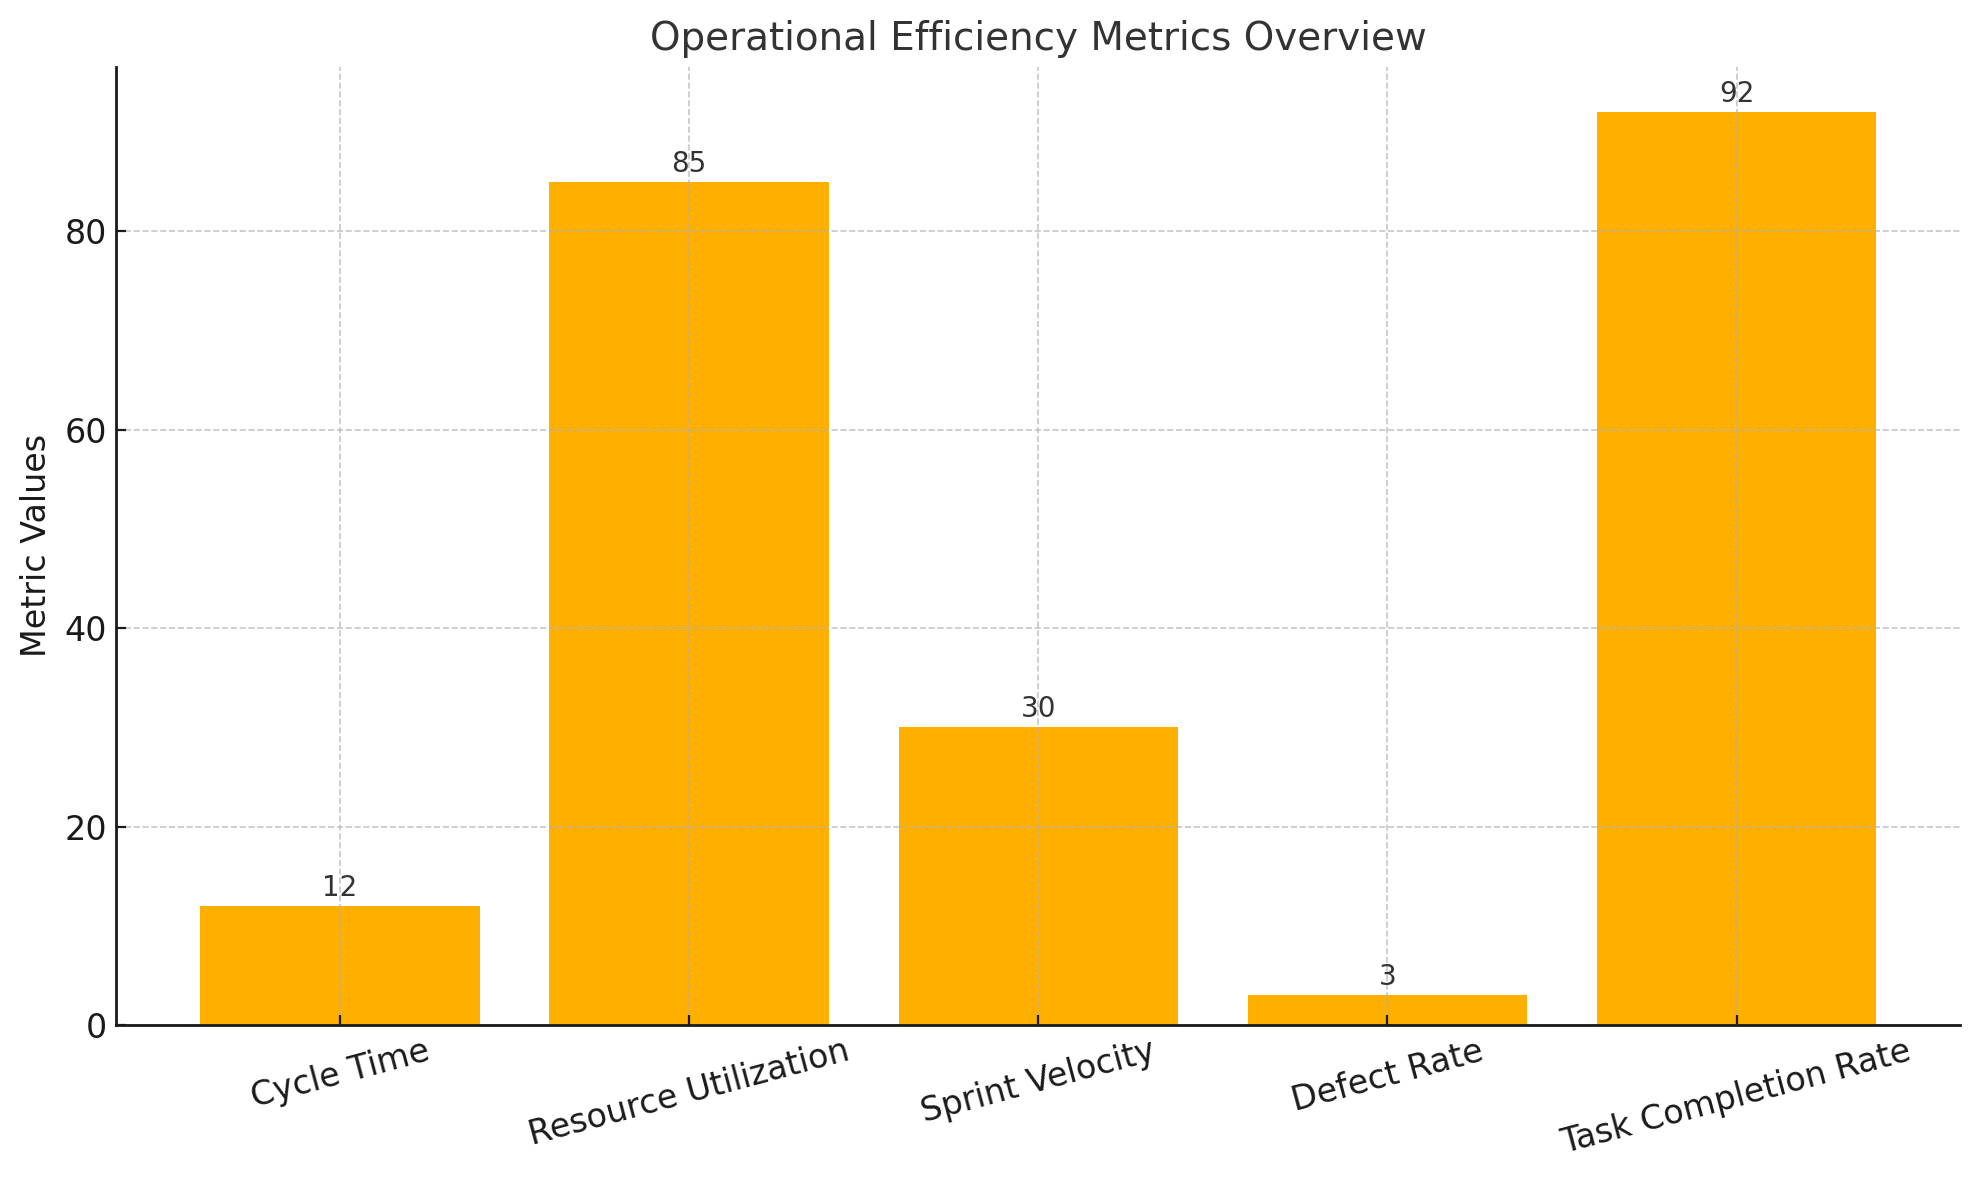 Operational efficiency metrics (Source: Aiswarya)
1. Development velocity: Measures the team’s output across project sprints, reflecting how many work units (e.g., story points or tasks) are completed within a set time frame.
Formula: Velocity =Total story points (or tasks) completed / Number of sprints
2. Time to market (TTM): Evaluates the total duration from the beginning of the project (ideation or planning) to final delivery or launch.
Formula: TTM = Release Date – Project Start Date
3. Cycle time: A crucial metric that measures the time it takes for a task or project to move from the "in progress" stage to completion. There are two common ways to calculate cycle time:
Single tasks or items: Cycle time = End date − Start date
Multiple units or tasks: Cycle Time= Number of units delivered / Net production time
4. Earned Value (EV): Quantifies completed work in terms of budgeted cost.
Formula: EV = % of Work Completed × Total Project Budget
5. Schedule Variance (SV): Measures the difference between planned and actual progress.
Formula: SV = Earned Value (EV) – Planned Value (PV)
6. Schedule Performance Index (SPI): Indicates time efficiency. Values above 1 mean the project is ahead of schedule
Formula: SPI = EV / PV
Example: A SaaS project meant to deliver a new feature in 8 weeks, starts slipping—tracking time-based KPIs can help isolate where and why delays occur.
If a project experiences a decline in development velocity and an increase in cycle times, it signals inefficiencies in execution. Project managers can respond by streamlining workflows, such as automating repetitive tasks, removing process bottlenecks, or refining sprint planning.
Cost and budget management
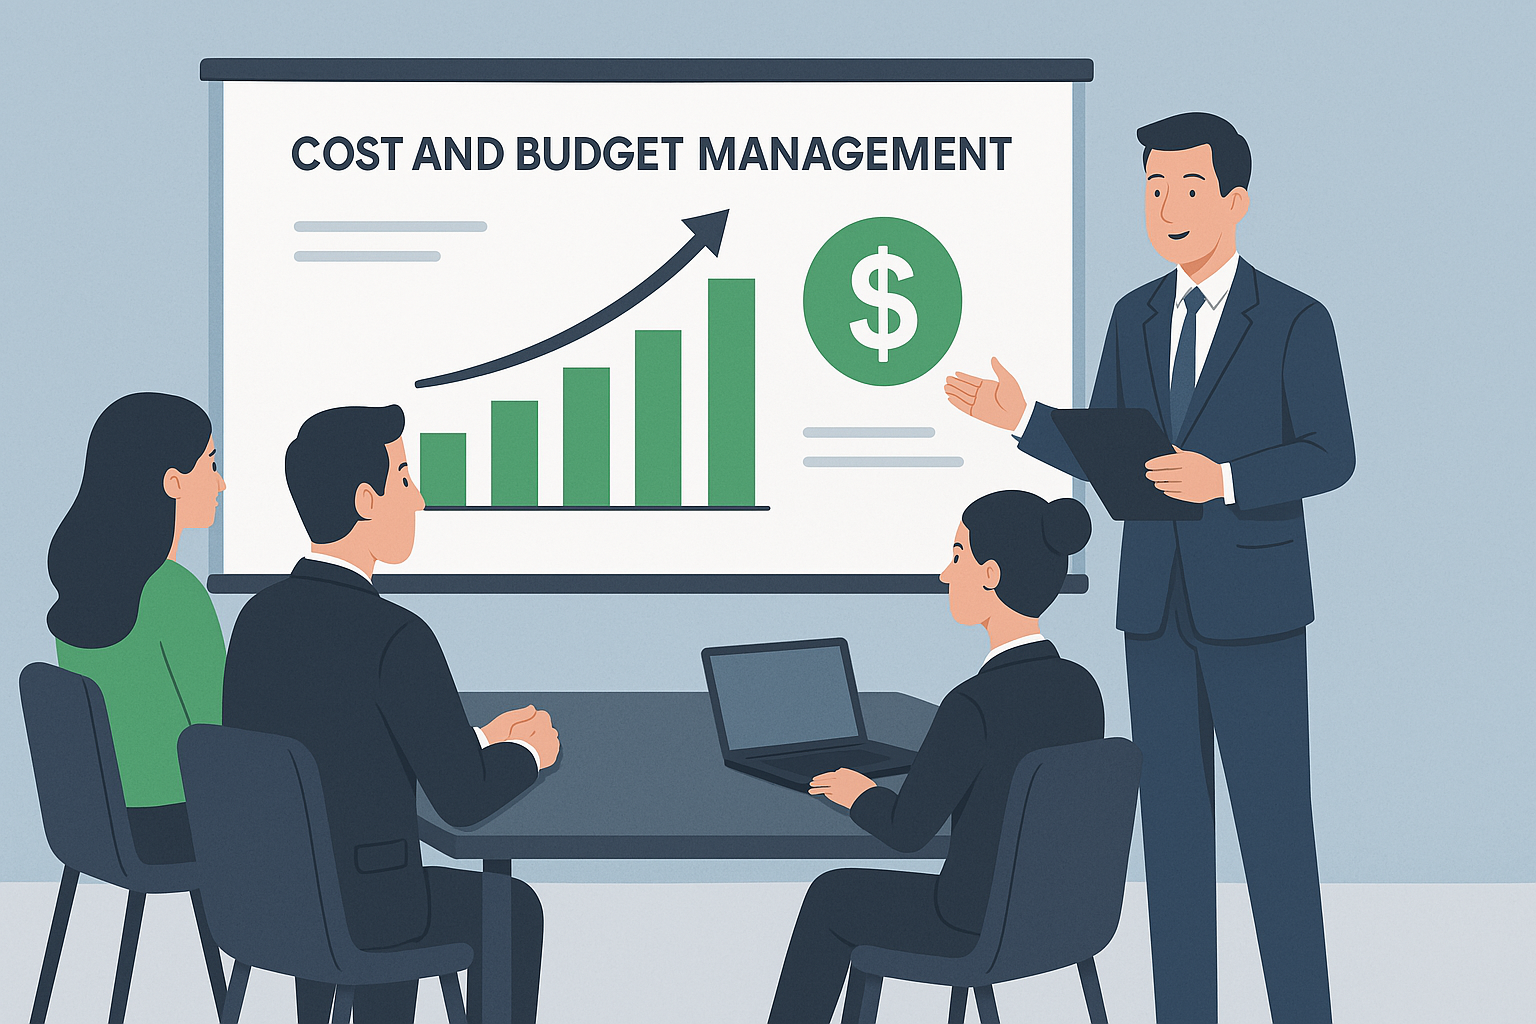 Cost and budget management metrics (Source: Aiswarya)
7. Cost Variance (CV): Identifies budget overruns or savings.
Formula: CV = EV – Actual Cost (AC)
8. Cost Performance Index (CPI): Measures cost efficiency. Values above 1 indicate you're under budget.
Formula: CPI = EV / AC
9. Budget Utilization Rate: Tracks how much of the allocated budget has been spent.
Formula: Budget Utilization = (Actual Cost / Total Budget) × 100
10. Return on investment (ROI): Measures the financial benefit gained from a project relative to its total cost.
Formula: ROI = (Net project benefit / Total project cost) × 100
Example: A game development project is halfway through, but 80% of the budget is already consumed. Cost metrics help catch overspending early.
If a project shows a high budget utilization rate early in the timeline and a declining Cost Performance Index (CPI), it signals potential overspending and poor cost efficiency. Project managers can respond by revisiting the project plan, reprioritizing tasks, or reallocating resources to control costs. These actions help prevent budget overruns, maintain financial stability, and ensure the project delivers value within approved limits.
Quality and delivery
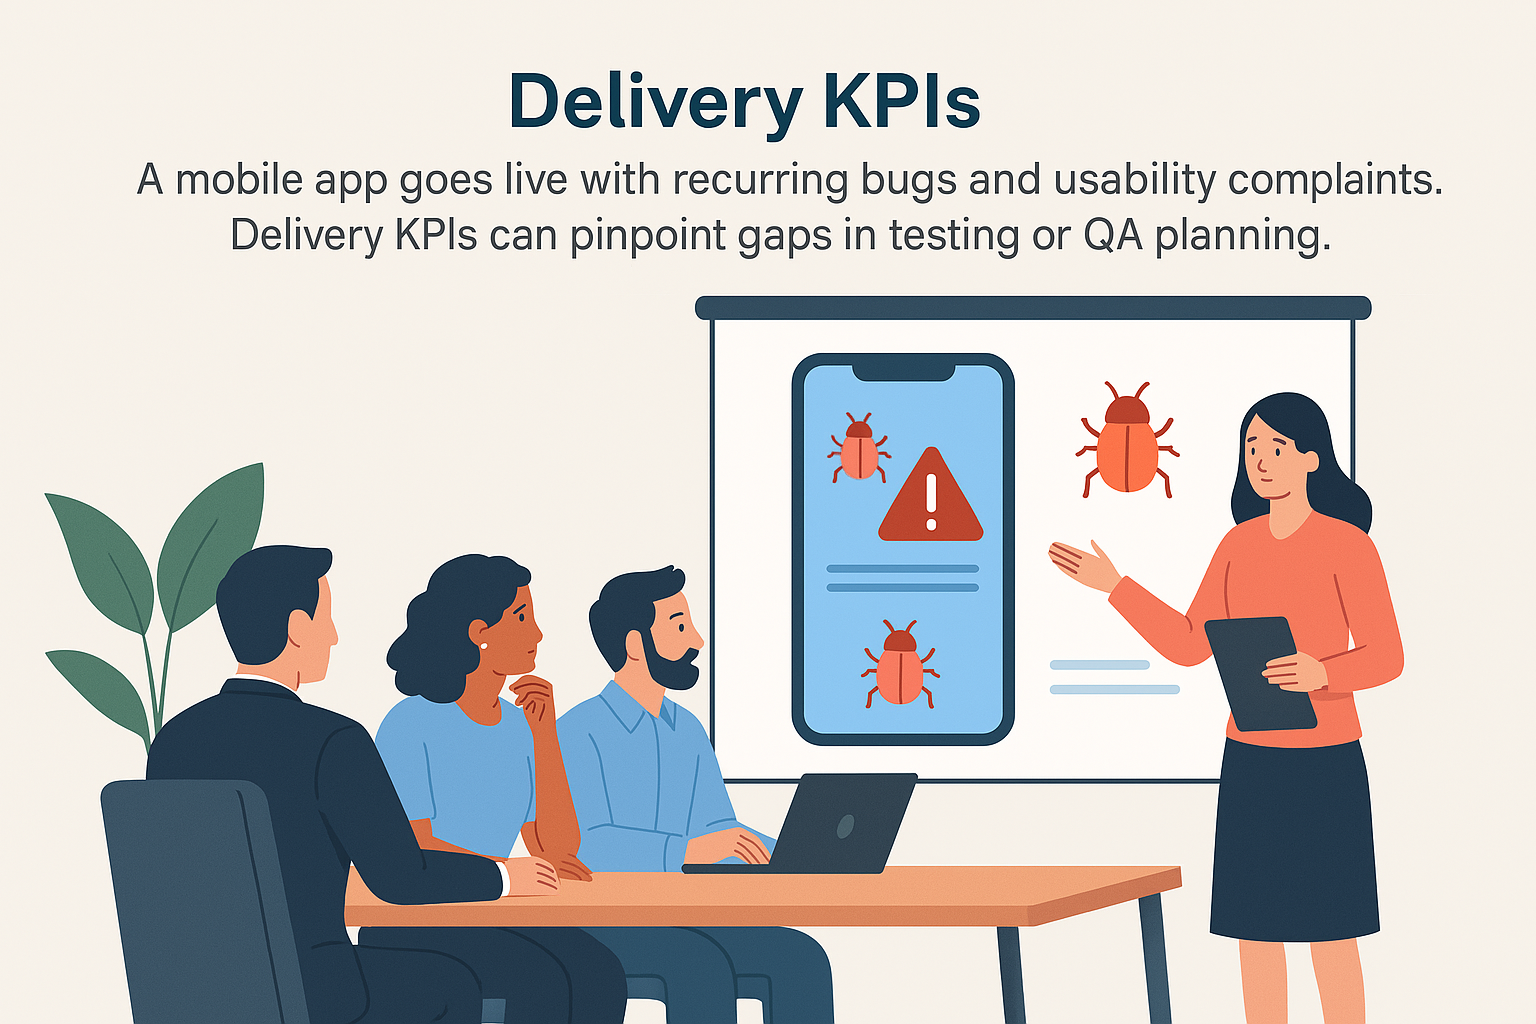 Delivery KPIs (Source: Aiswarya)
11. Defect Density: Tracks the number of bugs or issues per unit of output.
Formula: Defect Density = Number of Defects / Total Deliverables
12. Rework Rate: Measures how much effort was spent on redoing tasks due to errors.
Formula: Rework Rate = (Rework Hours / Total Project Hours) × 100
13. On-Time Delivery Rate: Shows the percentage of tasks or milestones delivered on time.
Formula: On-Time Delivery = (On-Time Deliverables / Total Deliverables) × 100
14. Product quality score (Defect rate): Tracks how often defects or quality issues occur in deliverables.
Formula: Defect Rate = (Number of reported bugs / Total releases) × 100
15. Innovation metrics: Evaluate the success of experimental features and initiatives.
Formula: Adoption rate = (New active users / Total signups) × 100
Example: A mobile app goes live with recurring bugs and frequent usability complaints, frustrating users and impacting adoption. Delivery KPIs can help identify where the quality assurance process fell short, whether it's insufficient test coverage, missed regression checks, or unrealistic release timelines.
If a project aimed at delivering a new feature results in a high defect rate and low user adoption, the project manager can use these quality and innovation metrics to assess delivery gaps, improve quality assurance (QA) processes, and iterate on user onboarding strategies.
Team performance metrics
 Team performance metrics (Source: Aiswarya)
16. Team velocity: Indicates how efficiently a project team delivers value over time by tracking the average number of completed story points (or work units) per sprint.
Formula: Velocity = Total completed story points per sprint / Number of sprints
17. Team satisfaction score (Employee satisfaction): Evaluates team engagement and morale using regular feedback surveys.
Formula: Employee satisfaction score = (Total survey score / Maximum possible score) × 100
18. Resource Utilization Rate: Evaluates how effectively team capacity is used.
Formula: Utilization Rate = (Billable Hours / Total Available Hours) × 100
Example: A development team’s velocity drops and satisfaction dips. Team KPIs help project leaders spot burnout and take action.
If a development team’s velocity declines and satisfaction surveys reflect signs of employee burnout, project leaders can rebalance workloads, revise sprint goals, or introduce automation. These actions help maintain team energy, reduce attrition risk, and ensure steady project execution.
Stakeholder engagement and customer satisfaction
 Stakeholder engagement and customer satisfaction (Source: Aiswarya)
19. Customer satisfaction score (CSAT): Measures how satisfied users are with the final outcome or project deliverable, such as a new feature rollout or platform migration.
Formula: CSAT = (Number of satisfied customer responses / Total number of customer responses) × 100
20. Net promoter score (NPS): Assesses how likely users are to recommend the solution or experience created through the project. A high NPS signals strong user approval and alignment with expectations.
Formula: NPS = % of Promoters (customers who rate 9-10) – % of Detractors (customers who rate a product 0-6 on a scale of 10)
Passive customers (the one who rate 7-8) are not included since they may be satisfied customers but won’t actively recommend your product
21. Customer effort score (CES): Evaluates how easily users can complete key tasks after project implementation, such as setting up a new feature, navigating a redesigned UI, or integrating tools.
Formula: CES = (Total effort score from surveys) / (Number of respondents)
22. Time-to-first value (TTFV): Tracks the time it takes for a user to realize value after project go-live. Shorter TTFV reflects smooth onboarding and clear outcomes.
Formula: TTFV = Date of first value realization – Date of initial interaction
23. Customer retention rate (CRR): Measures how many users continue engaging with the product or service after the project ends. Useful for evaluating enhancements or support rollout projects.
Formula: (Customers at period end – New customers) / Customers at the start × 100
24. Churn rate: Indicates the percentage of customers who stopped using the product following a change. High churn may suggest the project failed to meet expectations.
Formula: (Number of customers lost during period / Number of customers at start) × 100
25. Earned growth rate (EGR): Tracks revenue growth from existing users and referrals. A strong EGR shows that the project not only delivered value but also drove organic expansion.
Formula: EGR = [(Revenue this period – Revenue last period) / Revenue last period] × 100
Example: A SaaS team sees increased churn after a pricing update project. Analyzing CRR and EGR trends reveals whether loyal users are leaving or just not referring others, guiding targeted adjustments.
If CSAT or NPS declines after launching a new dashboard, reviewing CES and TTFV can reveal usability issues or onboarding gaps. While core KPIs track timelines, scope, and budget, customer-centric metrics show whether the project delivered real value, especially in SaaS or product-focused initiatives.
Risk and change management
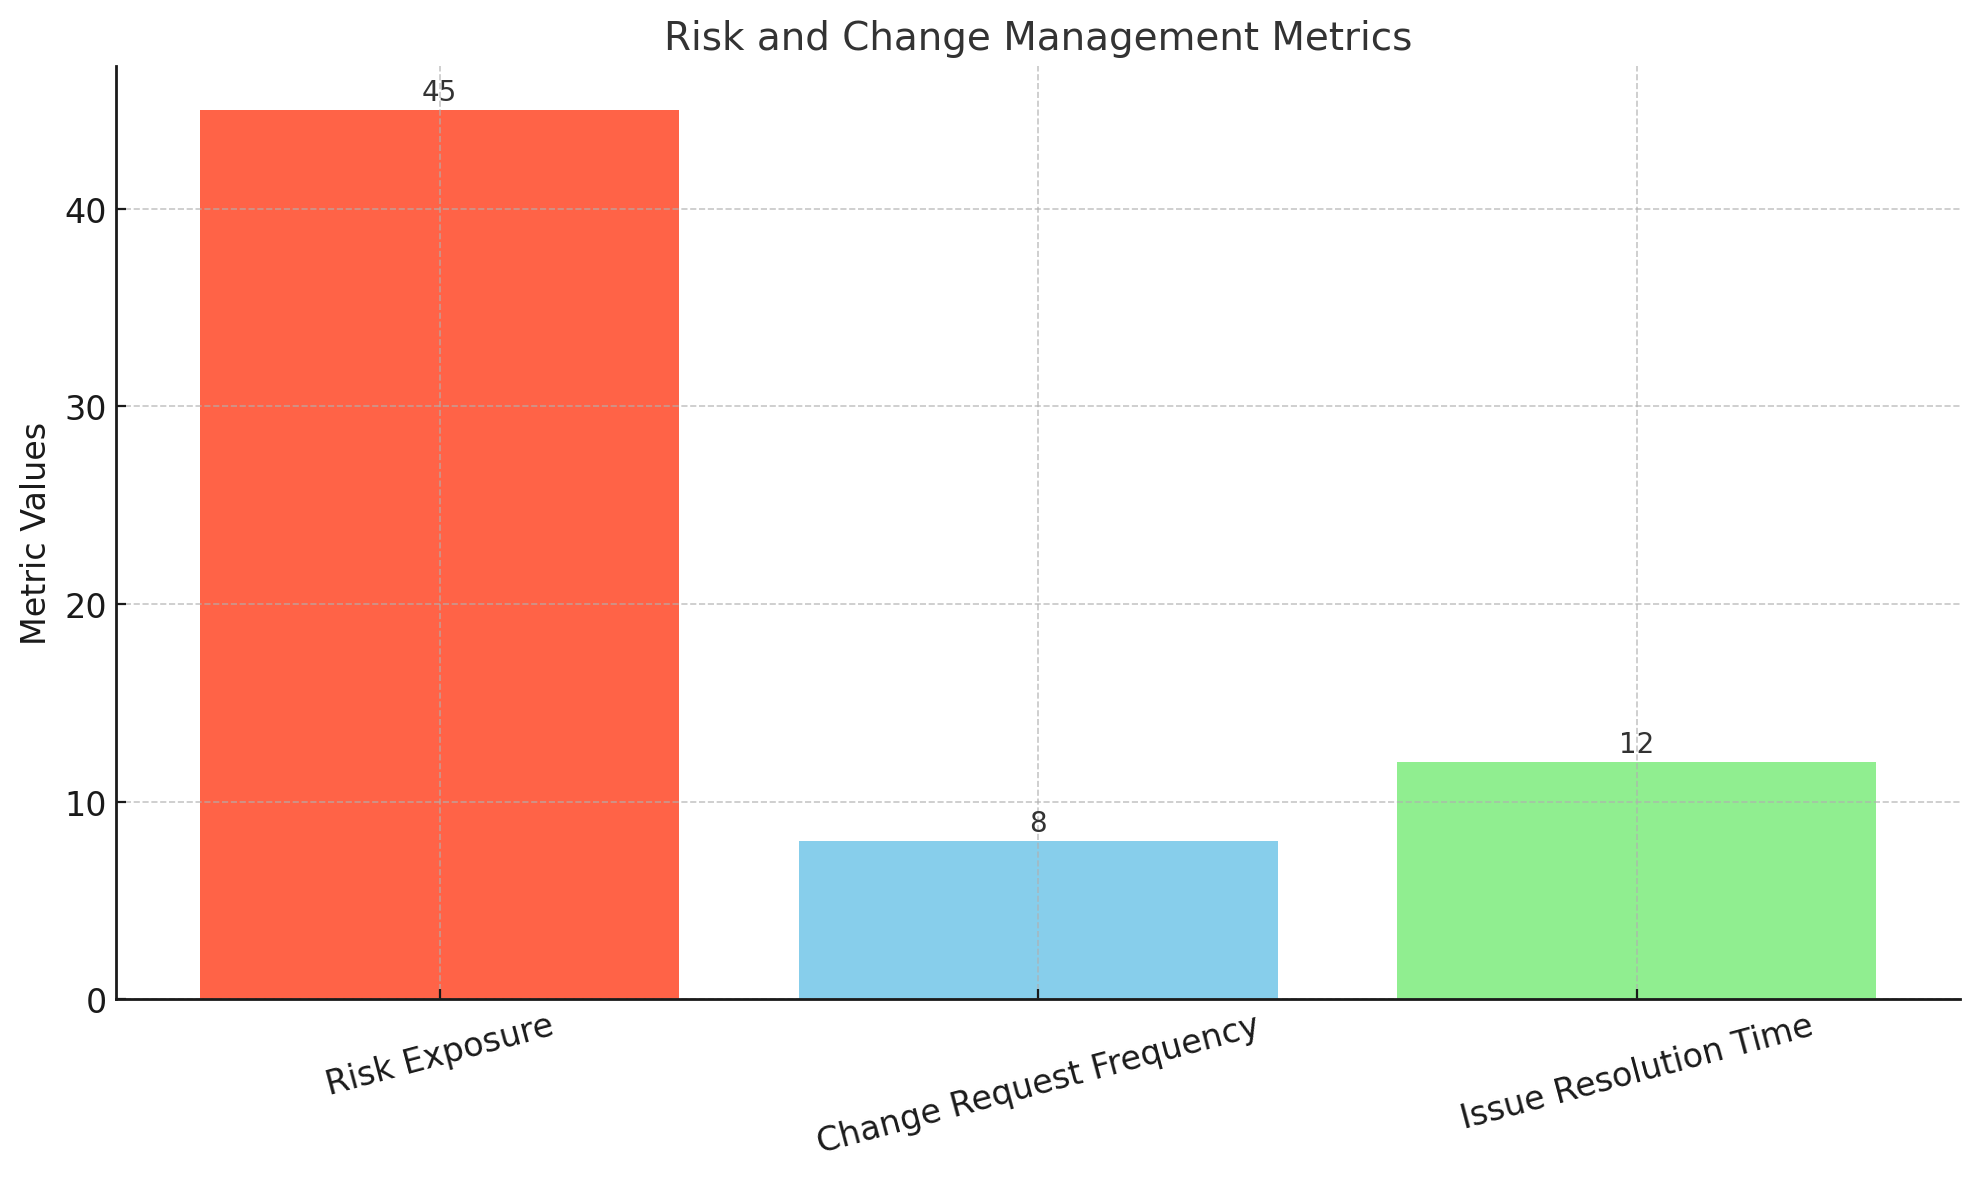 Risk and change management KPIs (Source: Aiswarya)
26. Risk Exposure: Measures the cumulative impact of all identified risks.
Formula: Risk Exposure = Risk Probability × Risk Impact
27. Change Request Frequency: Tracks how often project changes are proposed.
Formula: Change Frequency = Number of Change Requests / Project Duration
28. Issue Resolution Time: Measures how quickly risks or issues are resolved.
Formula: Average Issue Resolution Time = Total Time to Resolve Issues / Number of Issues
Example: Frequent scope changes derail a project. Tracking change and risk metrics helps keep everything controlled and documented.
These KPIs help project managers stay in control by highlighting potential threats and project volatility. Risk Exposure alerts them to high-impact risks early, Change Request Frequency signals scope stability, and Issue Resolution Time shows how effectively the team handles disruptions, allowing for proactive adjustments to keep the project on track.
Scope and workload management
29. Scope Creep Rate: Measures how much the project scope has expanded beyond initial plans.
Formula: Scope Creep Rate = (Number of Added Requirements / Original Requirements) × 100
30. Planned vs. Actual Work: Compares estimated work effort with what was actually done.
Formula: Variance = (Actual Hours – Planned Hours) / Planned Hours × 100
31. Workload Balance Index: Assesses how evenly work is distributed across team members.
Formula: Standard Deviation of Task Hours Assigned / Average Task Hours Assigned
Example: A team repeatedly misses sprint goals due to scope creep or unrealistic task allocation. These KPIs help bring visibility into workload distribution and scope control.
These KPIs help project managers maintain control over execution and team productivity. Scope Creep Rate highlights deviations from the original plan, enabling proactive scope management. Planned vs. actual Work and Workload Balance Index reveals effort discrepancies and uneven task distribution, helping optimize resource allocation and prevent team burnout.
Agile and iteration-based KPIs
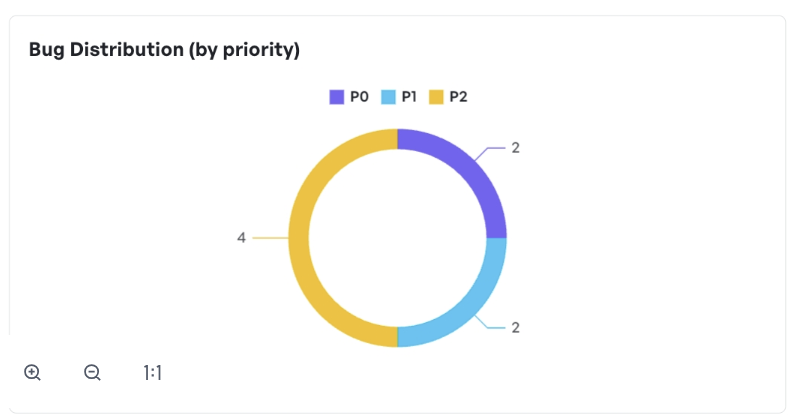 Bug distribution report in Meegle
32. Sprint Goal Success Rate: Measures how often sprint goals are fully met.
Formula: (Number of Successful Sprints / Total Sprints) × 100
33. Burndown Rate: Tracks how quickly work is being completed during a sprint.
Formula: Burndown = Estimated Remaining Work – Actual Completed Work (daily or weekly)
34. Lead Time: Time taken from task request to completion.
Formula: Lead Time = Completion Date – Request Date
Example: Your team uses Scrum, but sprint goals are often unmet. These KPIs help diagnose planning accuracy and team velocity.
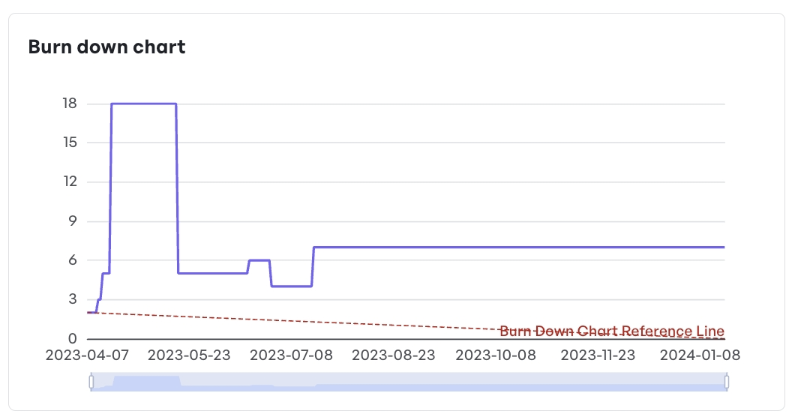 Burndown chart in Meegle
These KPIs are essential for Agile, Scrum, or Kanban teams that rely on iterative progress. They help assess sprint efficiency and team performance. For example, if sprint goals are consistently missed, metrics like Sprint Goal Success Rate, Burndown Rate, and Lead Time highlight planning gaps, workflow inefficiencies, or execution delays.
Suggested read: Choosing the Right Agile Development Tool: A Tailored Approach for Teams of Any Size
By integrating these metrics into your project management strategy, you gain a comprehensive toolkit that not only tracks performance across various dimensions but also provides actionable insights to optimize your project's success.
Step-by-step KPI implementation roadmap for project managers
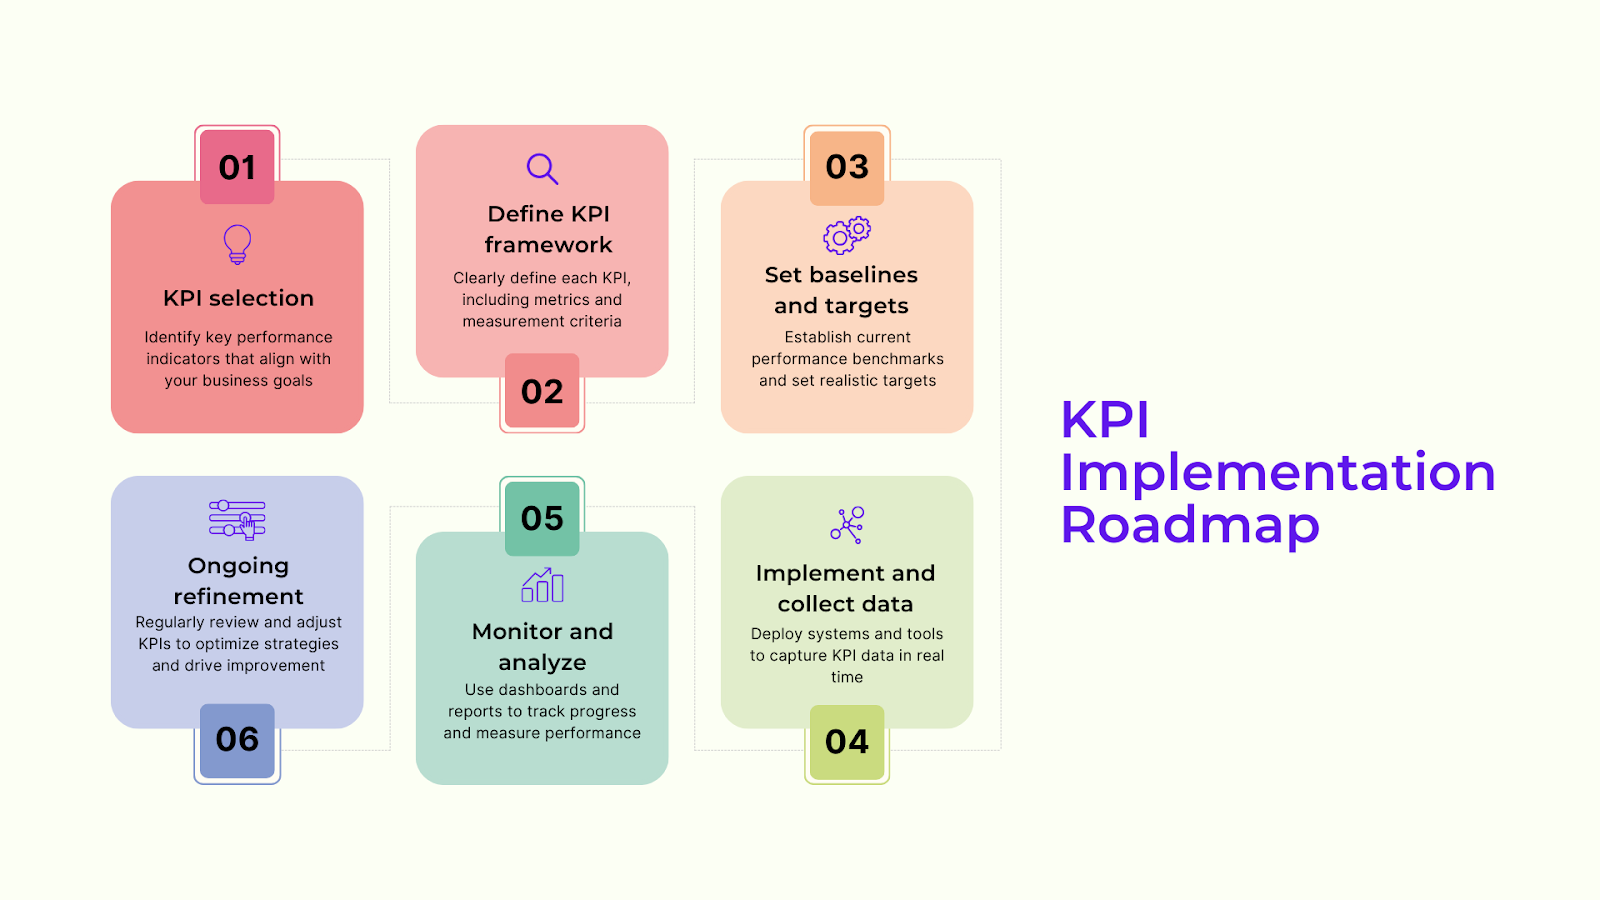 KPI implementation roadmap (Source: Aiswarya)
Challenges in tracking KPIs (and how to solve them)
For project managers, tracking the right KPIs across teams, timelines, and tools can feel like spinning multiple plates; one misstep and the whole operation wobbles.
Here are some of the most common KPI tracking challenges in project management, and how to overcome them for better clarity, accountability, and decision-making.
1. Data silos and inconsistent metrics
Problem: Project data often lives across disconnected platforms, task management tools, time trackers, budget sheets, QA systems, and stakeholder updates, making it difficult to generate a clear, unified picture of project health.
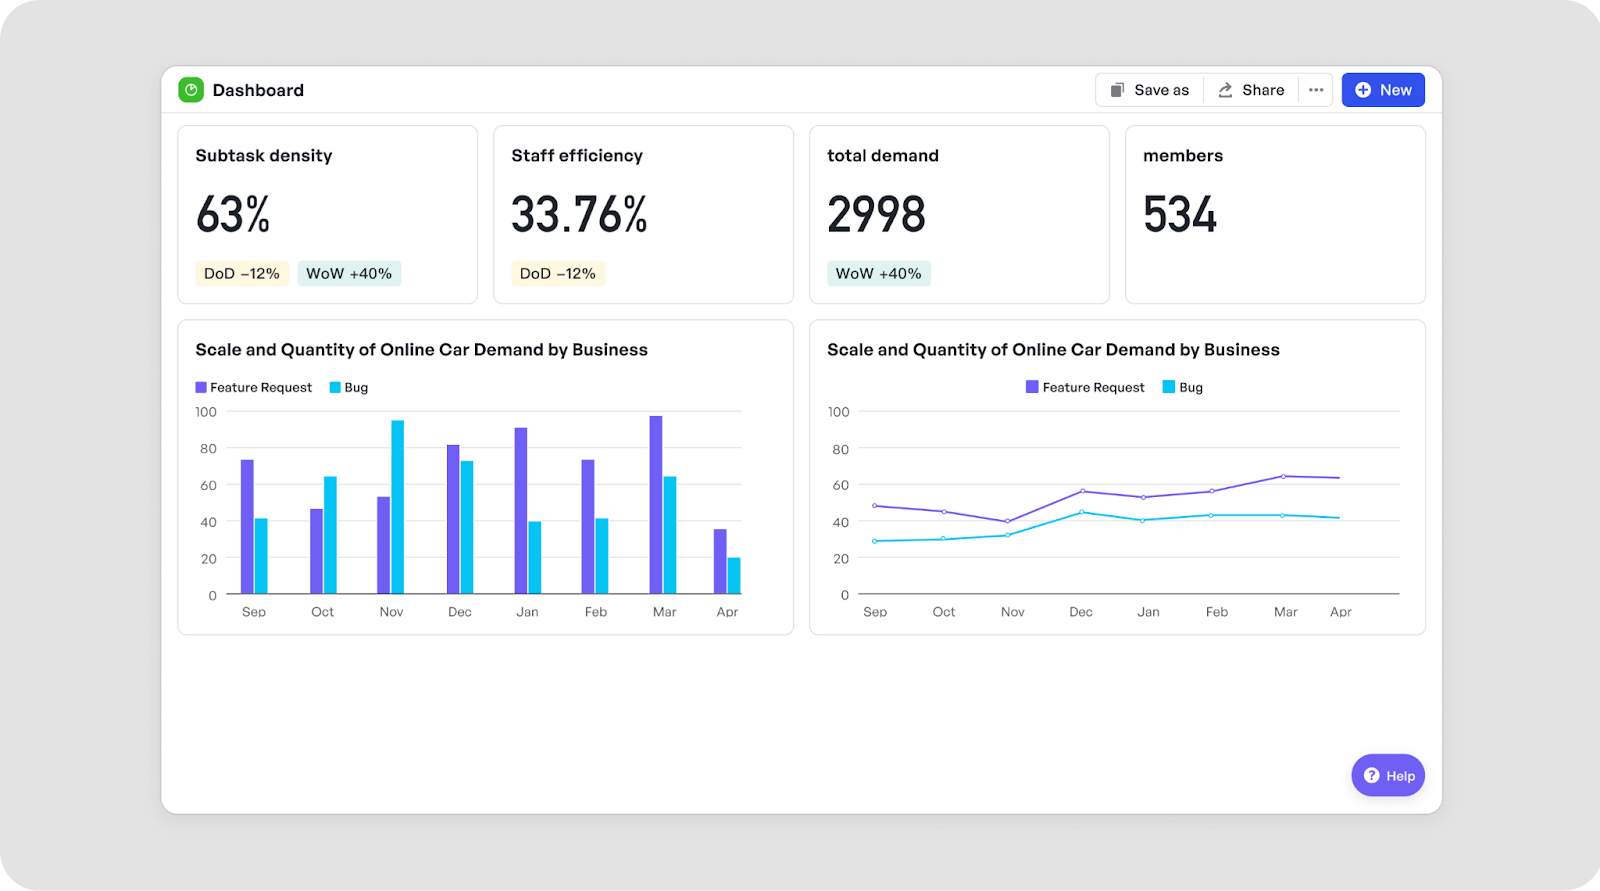 Meegle’s centralized dashboard that shows project efficiency
Solution: Integrate these sources with a centralized dashboard in Meegle to establish a single source of truth (SSOT) for real-time visibility into budget, progress, risk, and resource allocation.
2. Vanity metrics vs. actionable insights
Problem: Teams often highlight metrics that look good on paper, like total hours logged or number of completed tasks, without focusing on whether those efforts moved the project closer to its goals.
Solution: Prioritize actionable KPIs like Schedule Variance, Cost Performance Index (CPI), and Defect Rate, which offer direct insights into project success. Avoid metrics that don’t influence decision-making or stakeholder satisfaction.
Suggested Read: Strategic Goal Management: Aligning Ambitions with Action
3. Aligning cross-functional teams
Problem: When project contributors across departments (e.g., design, engineering, marketing) track different KPIs or use inconsistent definitions, it leads to confusion, miscommunication, and duplicated efforts.
Solution: Adopt frameworks like DACI (Driver, Approver, Contributor, Informed) to clarify roles and use centralized dashboards to ensure all teams work from the same data.
4. Balancing speed vs. quality
Problem: The pressure to deliver fast often leads to cutting corners, whether in QA, documentation, or resource planning. This results in high defect rates, missed dependencies, or costly rework.
Solution:
Use Agile frameworks to maintain consistent sprint velocity while introducing automated testing and review checkpoints. Track a combination of KPIs such as:
- Cycle Time and Sprint Completion Rate for delivery speed
- Defect Rate, Rework Time, or Customer Satisfaction Score for quality assurance
This dual approach ensures you meet deadlines without compromising on deliverable quality.
Track cross-functional project management KPIs in one place with Meegle
Enterprise project teams often face challenges in tracking the right KPIs across complex workflows, cross-functional teams, and overlapping timelines. Meegle simplifies this with a flexible, visual-first platform designed to support real-time project insights and streamlined decision-making.
Customizable dashboard templates for project KPIs
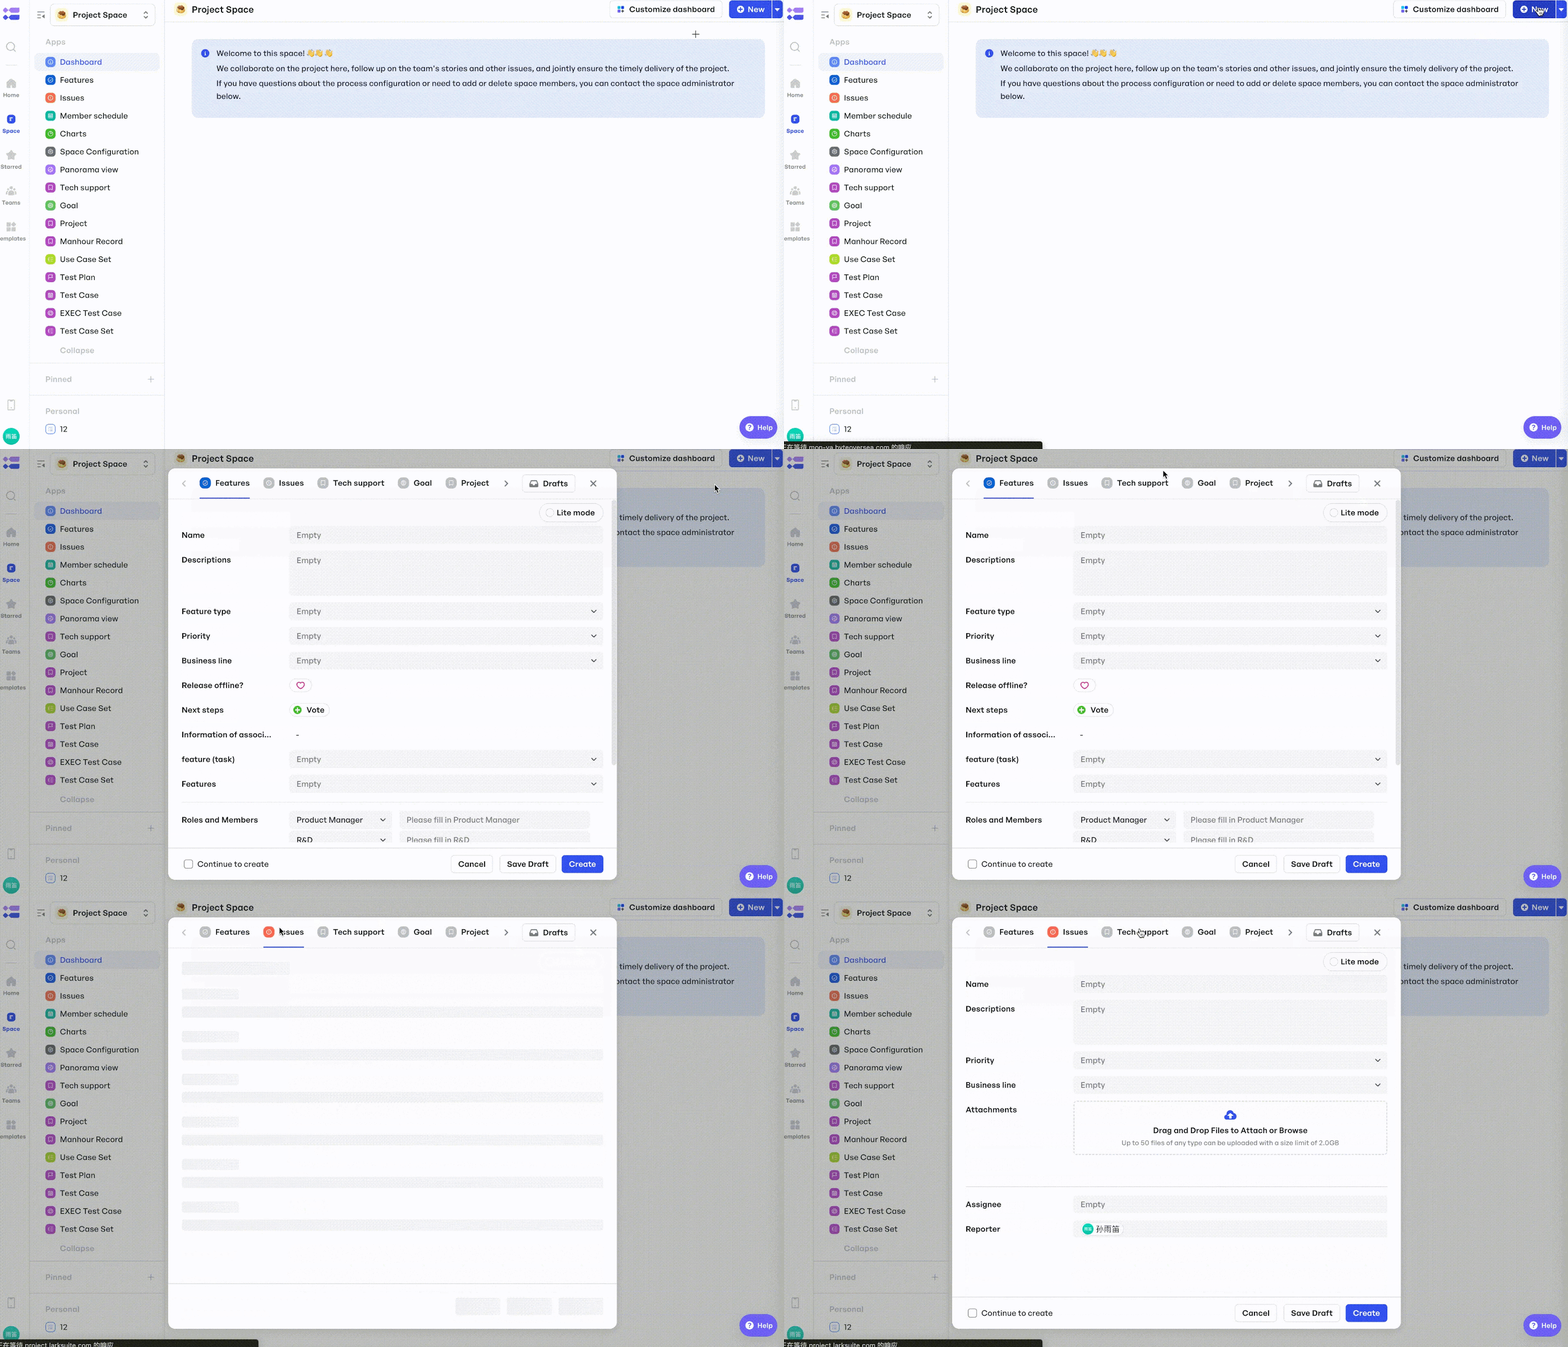 Customizable product management dashboard showing workflows and project collaboration space
Project managers need fast, actionable insights, not generic reports. Meegle’s customizable dashboards help teams stay aligned by showcasing metrics that reflect actual project progress and priorities:
- Start with pre-built templates tailored for methodologies like Agile, Waterfall, or hybrid frameworks
- Visualize project health using Gantt Charts, burndown graphs, and milestone tracking widgets
- Customize views to surface key KPIs such as task completion rate, resource utilization, or project risk index
Instead of squeezing your unique metrics into rigid formats, Meegle adapts to your project structure, so you’re always tracking what matters most.
With a centralized, visual dashboard as your single source of truth, Meegle breaks down information silos and keeps all stakeholders, from team leads to executives, on the same page.
Multiple views for different KPI contexts
Project teams need flexible perspectives to make sense of performance metrics at every stage. Meegle offers multiple view options, so project managers can monitor KPIs in ways that suit different workflows and stakeholder needs:
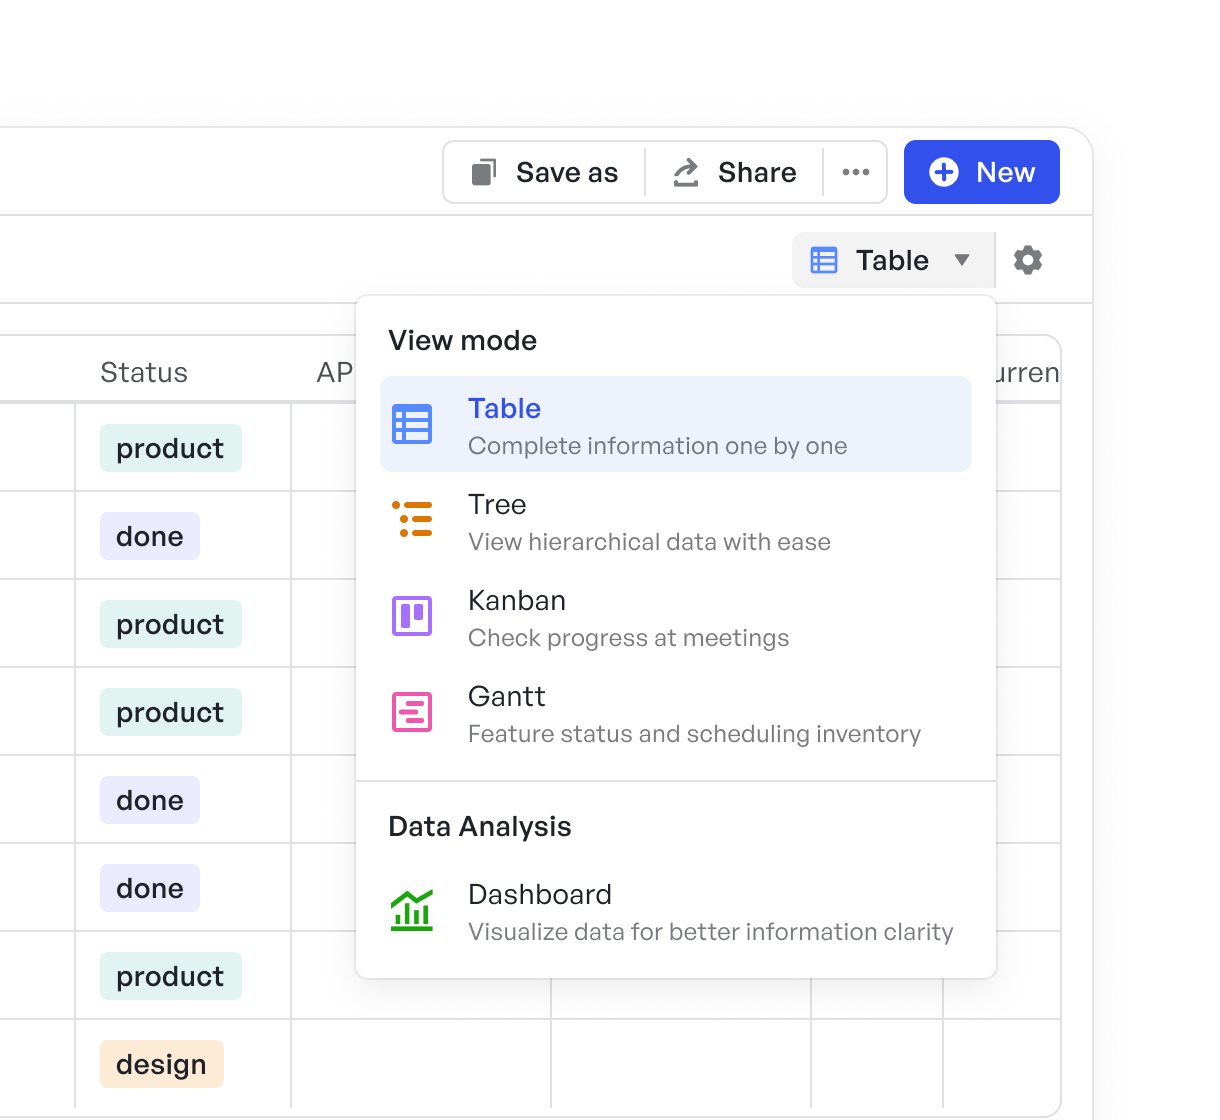 Multiple view options
- Table View: Organize project data in structured rows and columns for a detailed snapshot of task progress, budget usage, and risk indicators
- Tree View: Map out hierarchical links between project goals, deliverables, and sub-tasks to connect strategy with execution
- Kanban View:**** Track task status across phases and prioritize workstreams based on urgency or impact
- Gantt View: Visualize dependencies, timelines, and how scheduling shifts affect key milestones and performance outcomes
These flexible visualizations empower every stakeholder, whether it’s project managers, leadership, or cross-functional teams, to track what matters most without extra reporting overhead.
Visual workflow
One of the biggest hurdles in enterprise project management is maintaining visibility across intricate, multi-phase workflows. Meegle’s node-based visual workflow makes it easier to plan, track, and manage every moving part:
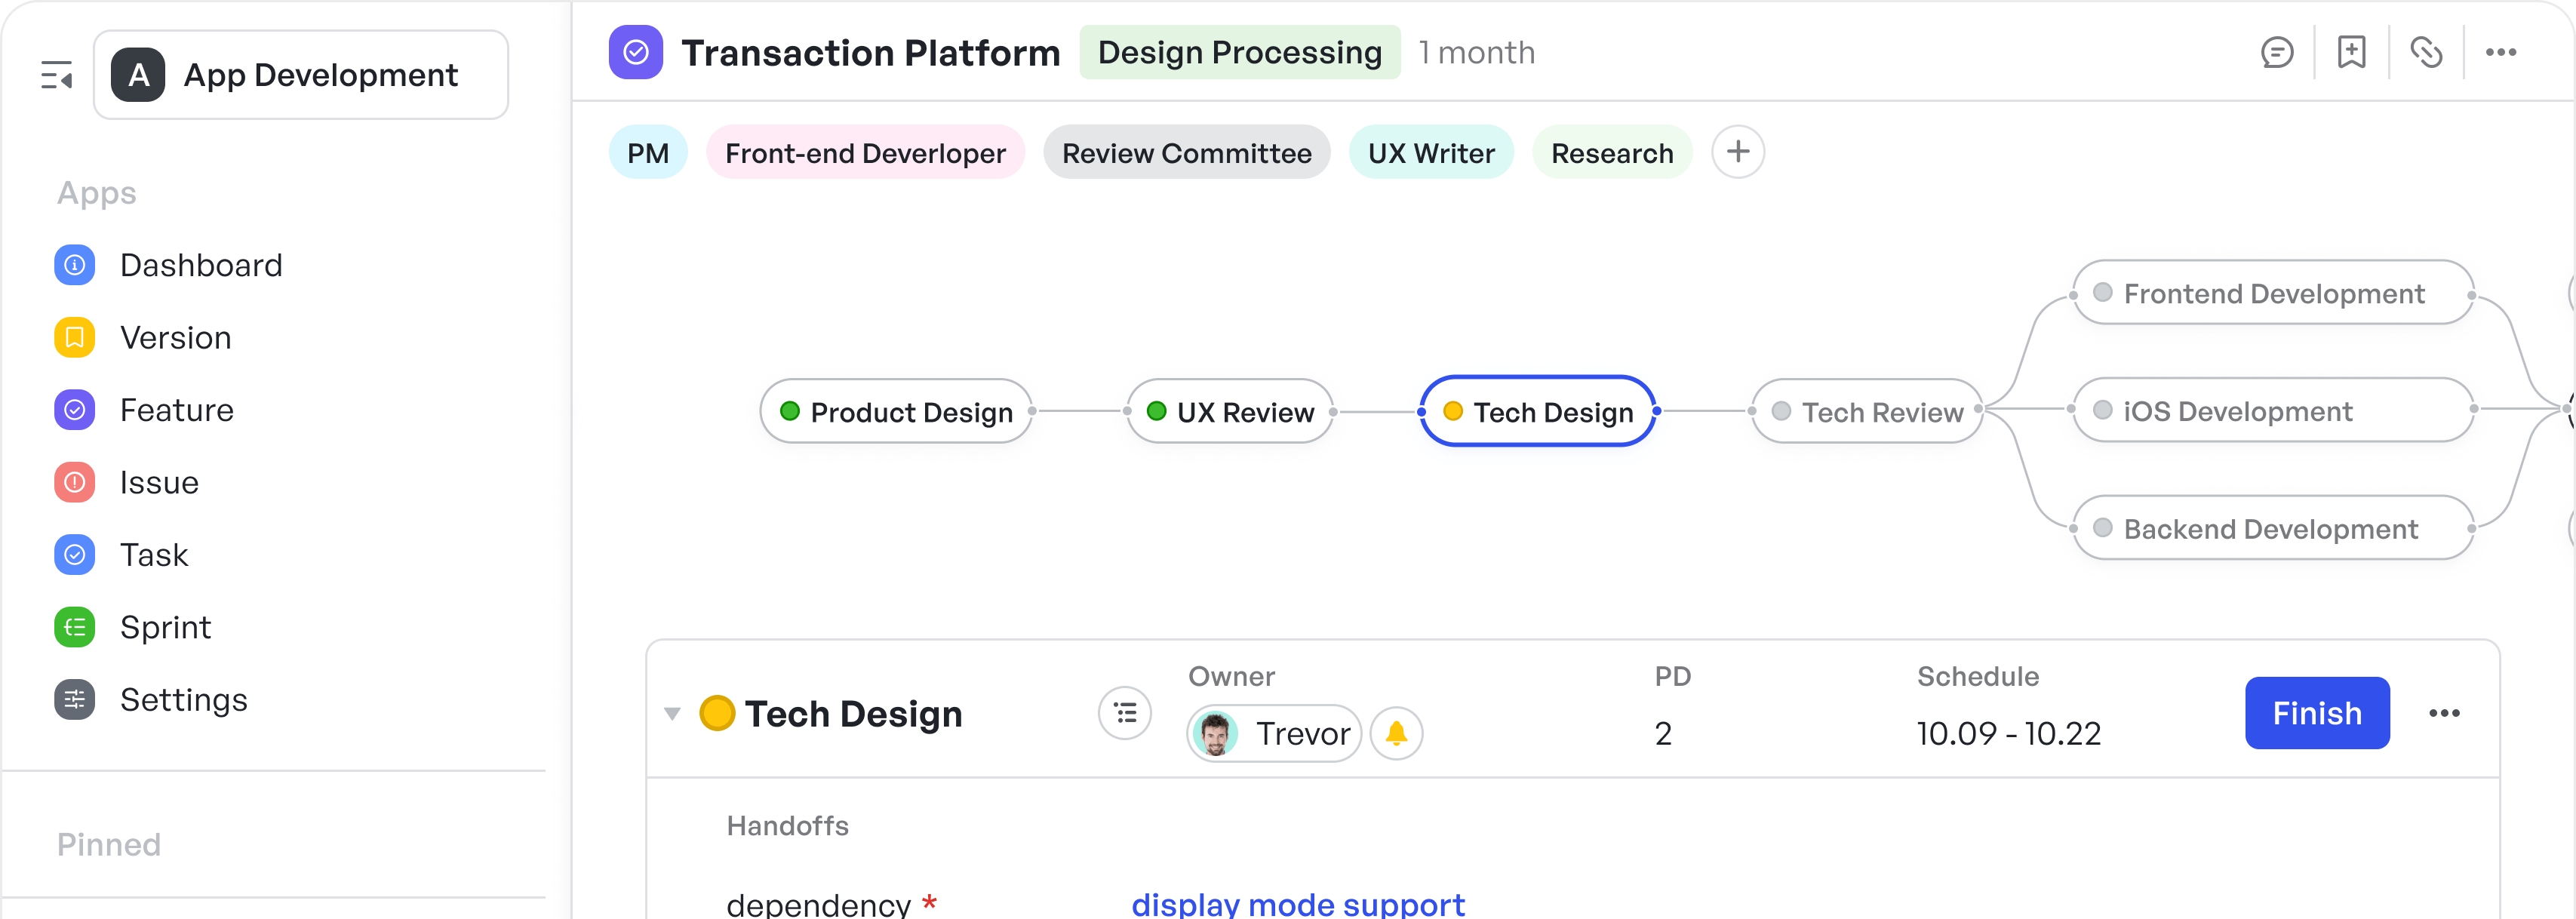
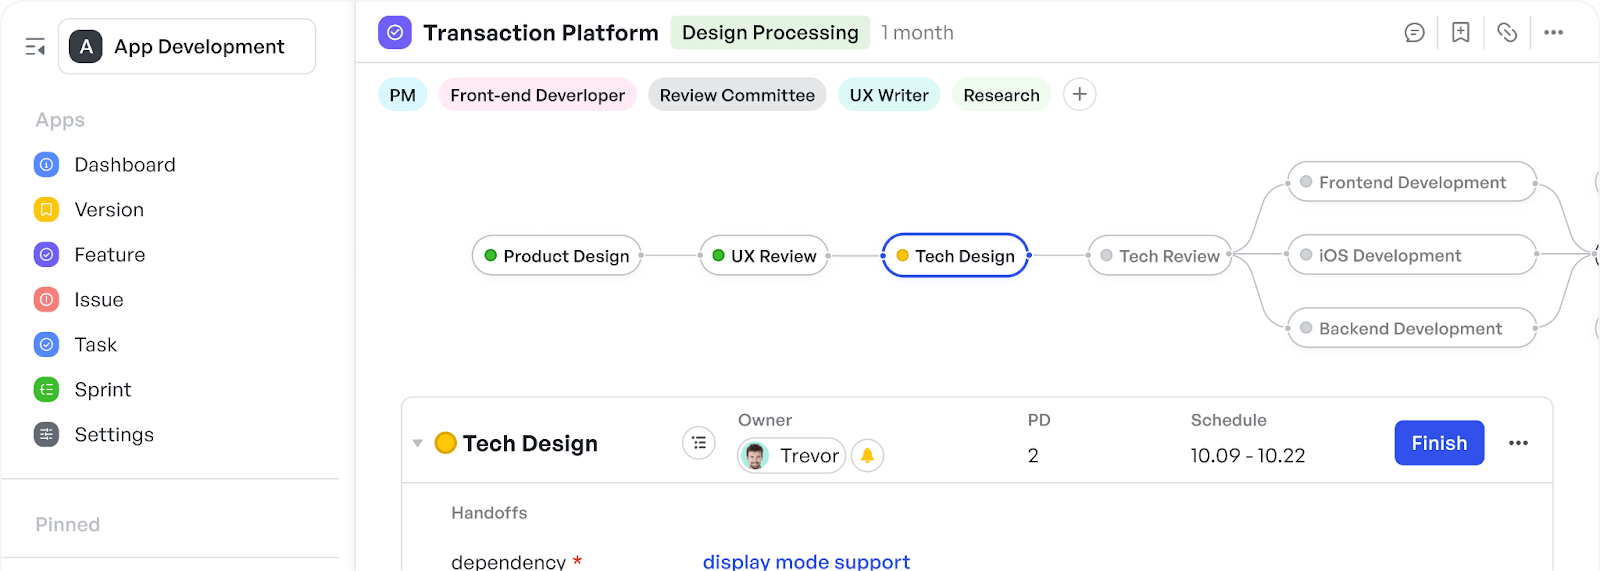 Visual product development workflow showing process nodes and dependencies for tracking KPIs and project milestones
- Break down complex project plans into connected nodes that represent tasks, milestones, and dependencies
- Give every team member a real-time, end-to-end view of project progress, ownership, and next steps
- Display critical context within each node—like task descriptions, deliverables, deadlines, and linked documents
This visual approach ties KPIs directly to the work being done, helping project teams understand not just the metrics, but the purpose behind them.
Charts for data-driven decisions
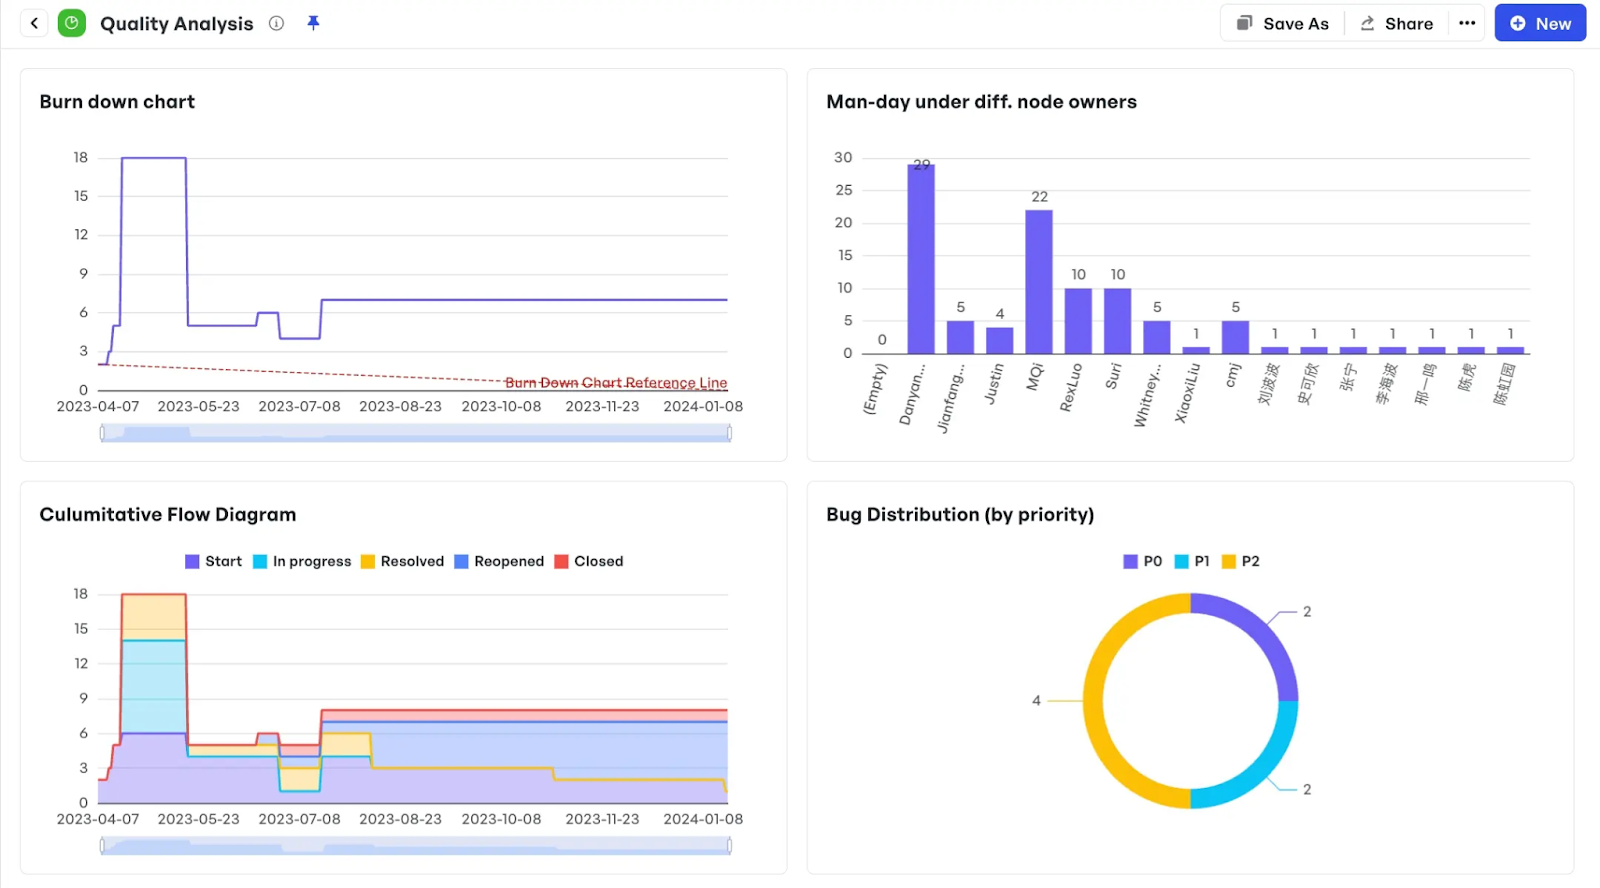 Charts showing product development metrics with burndown charts, workload distribution, and bug distribution data
Making strategic project decisions requires accurate, up-to-date information. Meegle’s charting capabilities help teams turn project metrics into meaningful direction:
- Create charts and reports using real-time project data, from task completion to budget tracking
- Spot patterns, delays, or resource bottlenecks early to prevent downstream issues
- Share visual insights with stakeholders to drive alignment on priorities, risks, and next actions
With Meegle, project KPIs become more than status updates; they become the foundation for smarter, faster decision-making.
Automation that simplifies KPI monitoring
Manual KPI tracking can drain time and focus from high-impact project work. Meegle removes that burden with automation built for project teams:
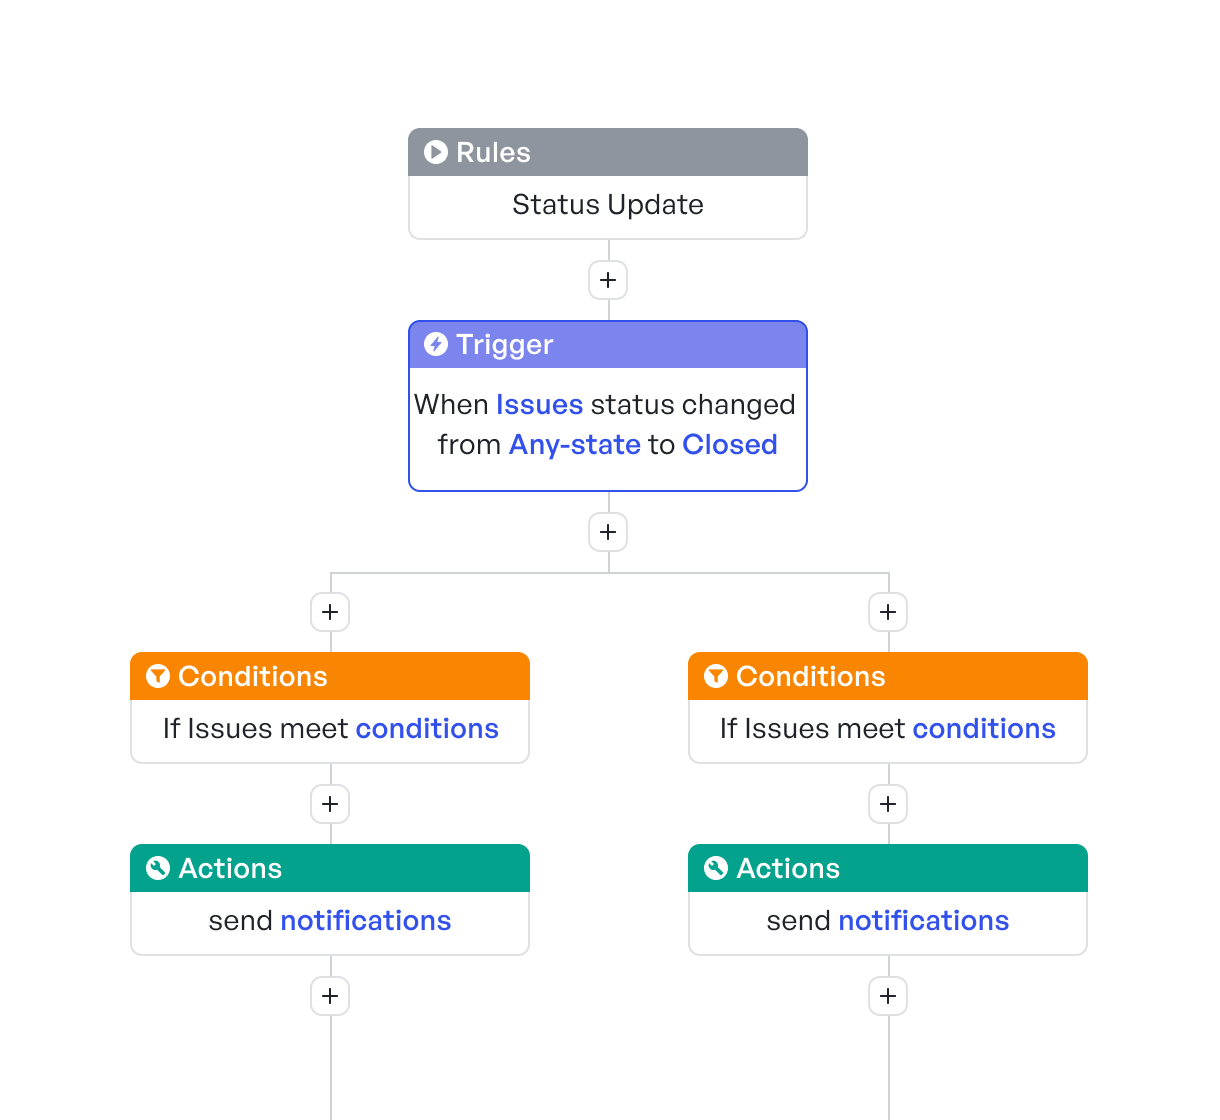 Automated workflow showing rules, triggers, conditions, and notification actions
- Automatically collect KPI data across tasks, timelines, and resource usage
- Set conditional triggers, for example, notify stakeholders when budget utilization exceeds a threshold or when task delays risk project timelines
- Schedule recurring reports to keep everyone aligned without the need for manual updates
This automation ensures consistent, real-time KPI tracking, so project managers can focus on strategy, not spreadsheets.
Integrations that streamline cross-functional KPI tracking
Tracking KPIs across multiple tools often leads to fragmented insights and extra manual work. Meegle solves this with seamless integrations:
 Meegle's integrations
- Connect with tools like Slack, GitHub, GitLab, and Zapier to centralize updates and communication
- Sync real-time data across platforms to maintain a unified view of project performance
- Automate task updates and notifications to reduce context switching and improve response time
These integrations ensure every team, engineering, marketing, design, or ops, stays aligned with shared project goals, with KPIs tracked in one place.
Looking to improve how your enterprise tracks and optimizes product management KPIs? Try Meegle for free and experience the difference a purpose-built product management platform can make.
FAQs
What are the KPIs in project management?
KPIs in project management are measurable values that track project health and progress. Common KPIs include on-time task completion, budget variance, scope changes, resource utilization, and team productivity. These metrics help project managers identify risks early, improve planning, and ensure alignment with business goals.
What is the KPI of a PMO?
PMO KPIs assess the effectiveness of a Project Management Office in driving strategic impact. Metrics such as project delivery success rate, portfolio alignment, resource optimization, governance compliance, and stakeholder satisfaction help determine if the PMO is enabling project success and contributing to organizational growth.
What is a KPI dashboard in project management?
A KPI dashboard in project management is a centralized visual display that consolidates key metrics like deadlines, milestones, cost performance, risk exposure, and team workload. It helps managers and stakeholders track progress in real time, make informed decisions, and ensure projects stay on schedule and within scope.
What are the leading indicators in project management?
Leading indicators in project management are forward-looking metrics that signal potential outcomes. Examples include task start delays, resource availability, risk log trends, and stakeholder engagement levels. These indicators help teams identify bottlenecks early and take corrective action before issues escalate into delays or cost overruns.
The world’s #1 visualized project management tool
Powered by the next gen visual workflow engineRead More
Check All BlogsStart creating impactful work today
